When a bank decides whether to approve a loan, a model estimates the probability of default, the chance the applicant fails to repay, and the bank approves everyone below some risk cutoff. Most banks still run decades-old scorecard technology for this, and replacing one is less a modeling problem than a proof problem: a new model must be measurably better, it must not discriminate, every decline must be explainable to the applicant by law, and all of it must survive a model validator whose job is to find reasons to say no. The purpose of this project is to build that entire arc, model, fairness audit, dollar impact, explanations, and governance paperwork, and to do it on data where the fairness audit can be proven to work, because the bias was planted deliberately and the audit either finds it or it does not.
The impact is concrete on both sides of the trade. The champion model lifts Gini by 0.102 over the incumbent scorecard, which at a constant 70% approval rate translates to an estimated $13.8M (19.2%) reduction in annual default losses on the simulated 800,000-application portfolio, or, taken the other way at constant risk, 57,998 additional approvals per year. And the audit demonstrably earns its place: a naive challenger with even higher Gini is rejected because it fails the four-fifths fairness rule, which is exactly the model a team without the audit would have shipped. The code is at github.com/gradientsj/credit-risk-model.
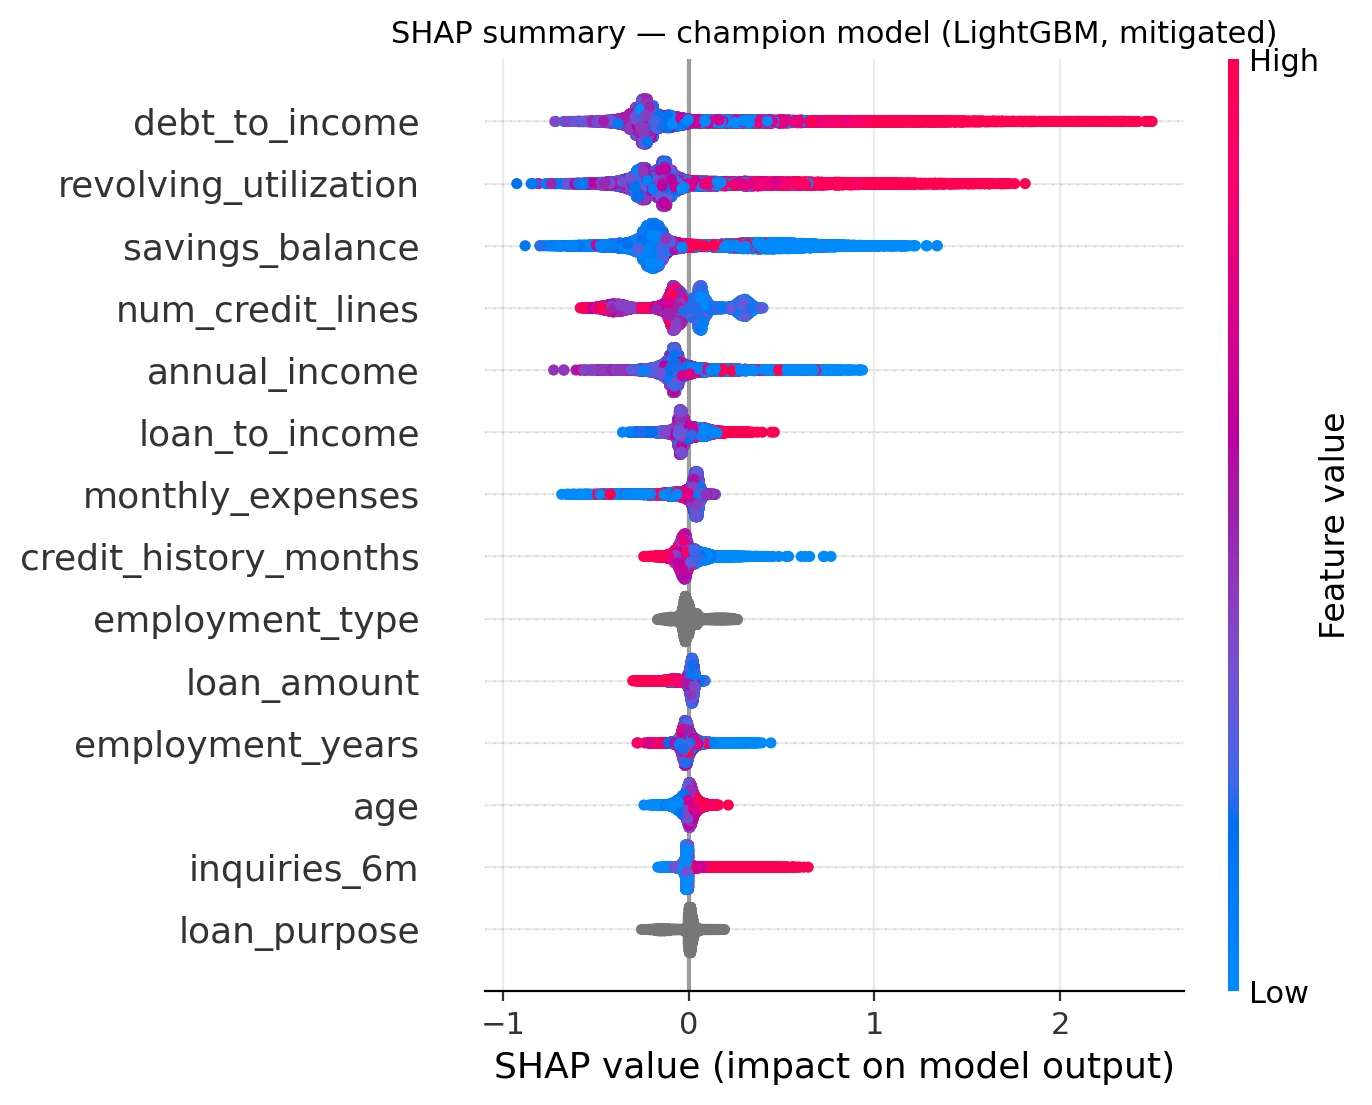
The system at a glance
Step 1: data where the answer key is known
Real lending data cannot be published, but the deeper reason this project simulates its portfolio is that real data can never tell you whether your fairness tests actually work. If an audit of a real model comes back clean, there is no way to distinguish "the model is fair" from "the audit is blind". So the simulator generates 800,000 applications with correlated bureau-style features (income, utilization, delinquencies, savings, and so on, with an 8.0% default rate), makes the protected attributes causally inert by construction, meaning they have no effect on whether anyone defaults, and then injects bias through two parameterized mechanisms. One is a proxy feature, a regional default-rate index that silently encodes protected-group membership, the classic shape of redlining. The other under-reports income for one segment, so equally creditworthy applicants arrive with worse-looking files. Because the bias is planted, the fairness suite can be tested like software: it must fail the biased configuration and pass the clean one, and the repository's tests assert exactly that. A companion pipeline runs the same comparison on real data, the Home Credit Default Risk dataset of roughly 307,000 applications, so the method is not stranded on synthetic ground.
The default risk itself is built from regime interactions: whether high card utilization is dangerous depends on whether the borrower revolves a balance or pays in full, and whether high leverage is dangerous depends on liquidity buffers. That matters because the incumbent technology cannot express such interactions, which is precisely what creates the challenger's headroom.
Step 2: four models, including the incumbent
The incumbent is a weight-of-evidence scorecard, the standard the industry actually runs. Each feature is cut into bins, each bin gets a weight reflecting how its default odds compare to the population average, and a logistic regression over those binned weights becomes a points scale (here calibrated so 20 points double the odds). Scorecards survive because every point of every score can be read off a table, which regulators and validators like, but the binning makes each feature contribute independently, so interactions like "high utilization and a revolver" are invisible to it.
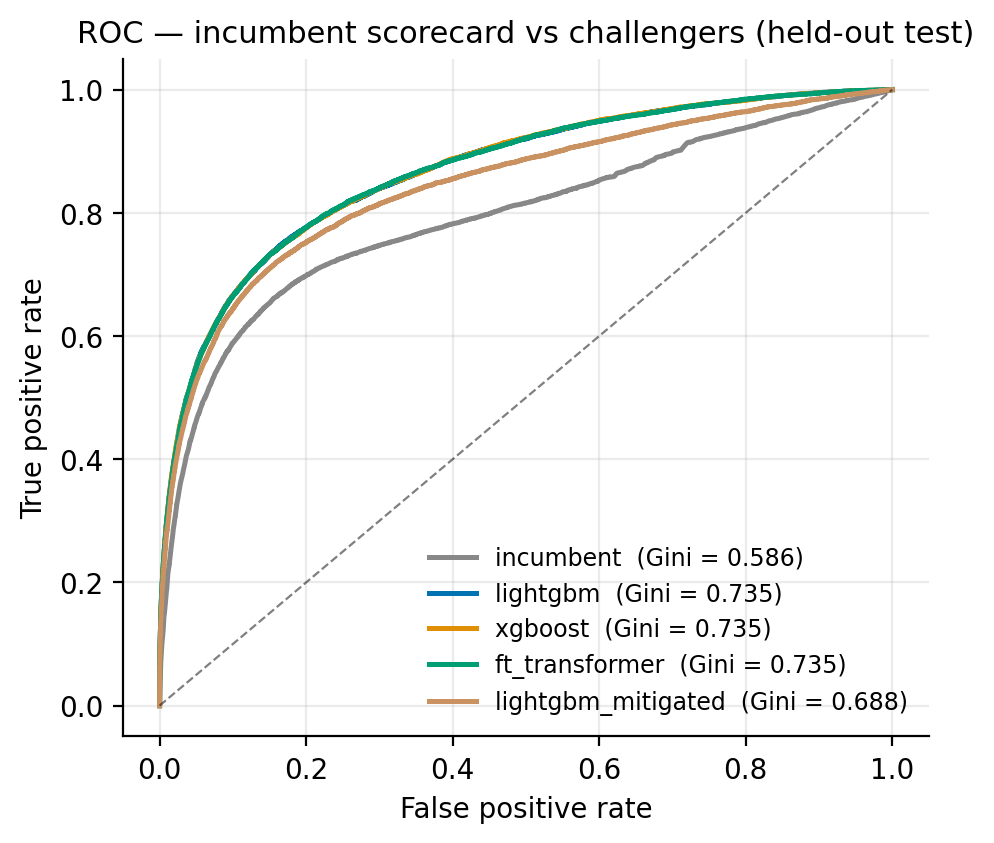
The challengers are gradient-boosted trees, LightGBM and XGBoost, which learn interactions natively, plus an FT-Transformer implemented from scratch in PyTorch following Gorishniy et al. 2021: every numeric and categorical feature is projected to an embedding, a CLS token is prepended, and a pre-norm transformer encoder attends across features. It is included to answer a question validators ask: does deep learning earn its complexity on tabular credit data? On the held-out test set of 160,000 applications it scored Gini 0.7346, against 0.7346 for LightGBM and 0.7352 for XGBoost, a tie. A tie is a useful result: it says the extra architecture, GPU dependency, and explainability burden buy nothing here, and the boosted trees keep the job.
Step 3: the audit that changes the answer
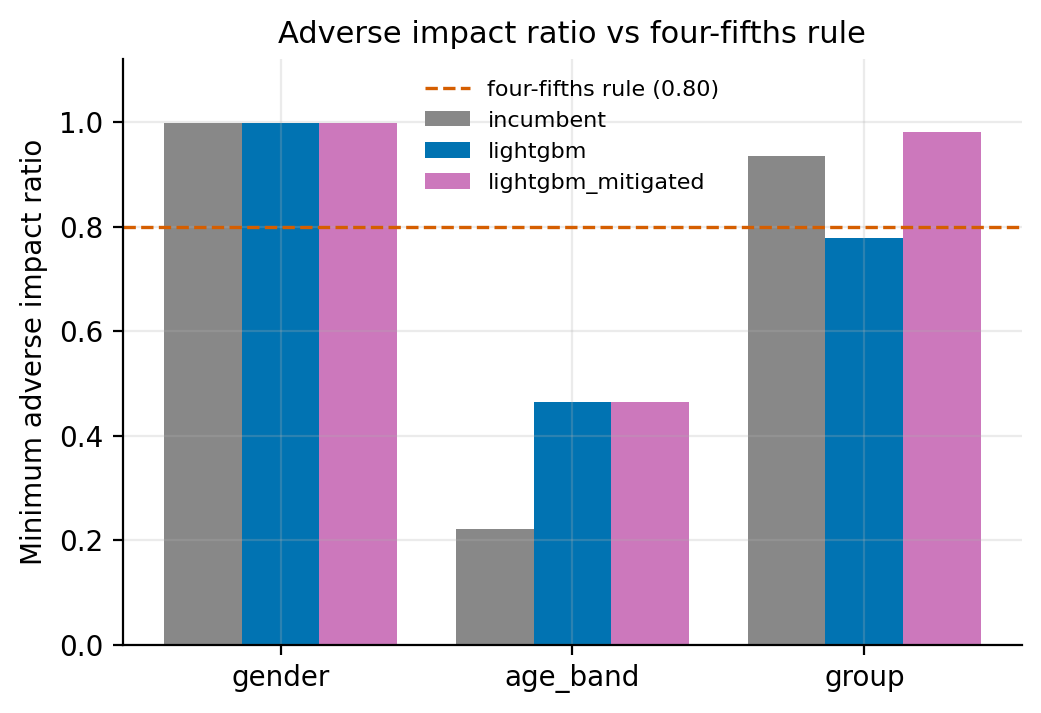
Gini is the industry's ranking metric, equal to 2*AUC - 1: a model with Gini 0 ranks applicants no better than chance, 1 is perfect separation of defaulters from payers. The naive LightGBM challenger reached Gini 0.7346 against the incumbent's 0.5862, a lift of 0.148, and on accuracy alone it ships. The fairness audit says otherwise. The adverse-impact ratio compares approval rates across groups: if one group is approved at 62% and another at 80%, the ratio is 0.78, and the four-fifths rule, the threshold US regulators use as a screen, flags anything under 0.80. The naive challenger's ratio across the protected group is 0.777, a fail, and the cause is traceable: it leaned on the regional index, the planted proxy. This is the audit catching exactly the mechanism it was designed to catch, on a model that looks excellent by every accuracy metric.
The mitigation excludes the proxy feature and retrains. The champion lands at Gini 0.6879 (bootstrap 95% CI 0.678 to 0.699), keeping a +0.102 lift over the incumbent while the adverse-impact ratio recovers to 0.981, with an equal-opportunity gap (the difference in how often truly good borrowers are approved across groups) of 1.5 percentage points. The audit costs some accuracy, 0.688 against the naive 0.735, and that cost is the price of a model that can survive a fair-lending review; quantifying it is part of the result.
One deliberate nuance: the audit also reports age-band disparity, and every model, including the incumbent scorecard, fails the four-fifths screen on age, because in this portfolio (as in real ones) default risk genuinely differs by age. US law explicitly permits empirically derived scorecards to differentiate on that basis, and the calibration-by-group numbers show the score gaps track realized default rates rather than mislabeling good borrowers. Telling that case apart from the proxy case, disparity from real risk versus disparity from leakage, is the actual skill a fair-lending review needs, so the benchmark contains both.
Step 4: what it is worth in dollars
Gini points do not appear in a budget, so the evaluation converts the lift with a swap-set analysis: hold the approval rate fixed at 70% and look at who changes decision under the new score. The champion swaps 12,956 applicants in and the same number out; the swapped-in group defaults less than the swapped-out group, and pricing that difference (defaults times loan amount times a 55% loss given default, assumptions stated in the repo) yields annual losses of $57.8M against the incumbent's $71.6M, the $13.8M (19.2%) reduction. Alternatively the bank can hold risk constant and approve more: the same risk appetite supports a 77.2% approval rate, 57,998 more approvals per year, which is the version of the story where better ranking becomes access to credit rather than saved losses.
Step 5: twelve models on the approved features
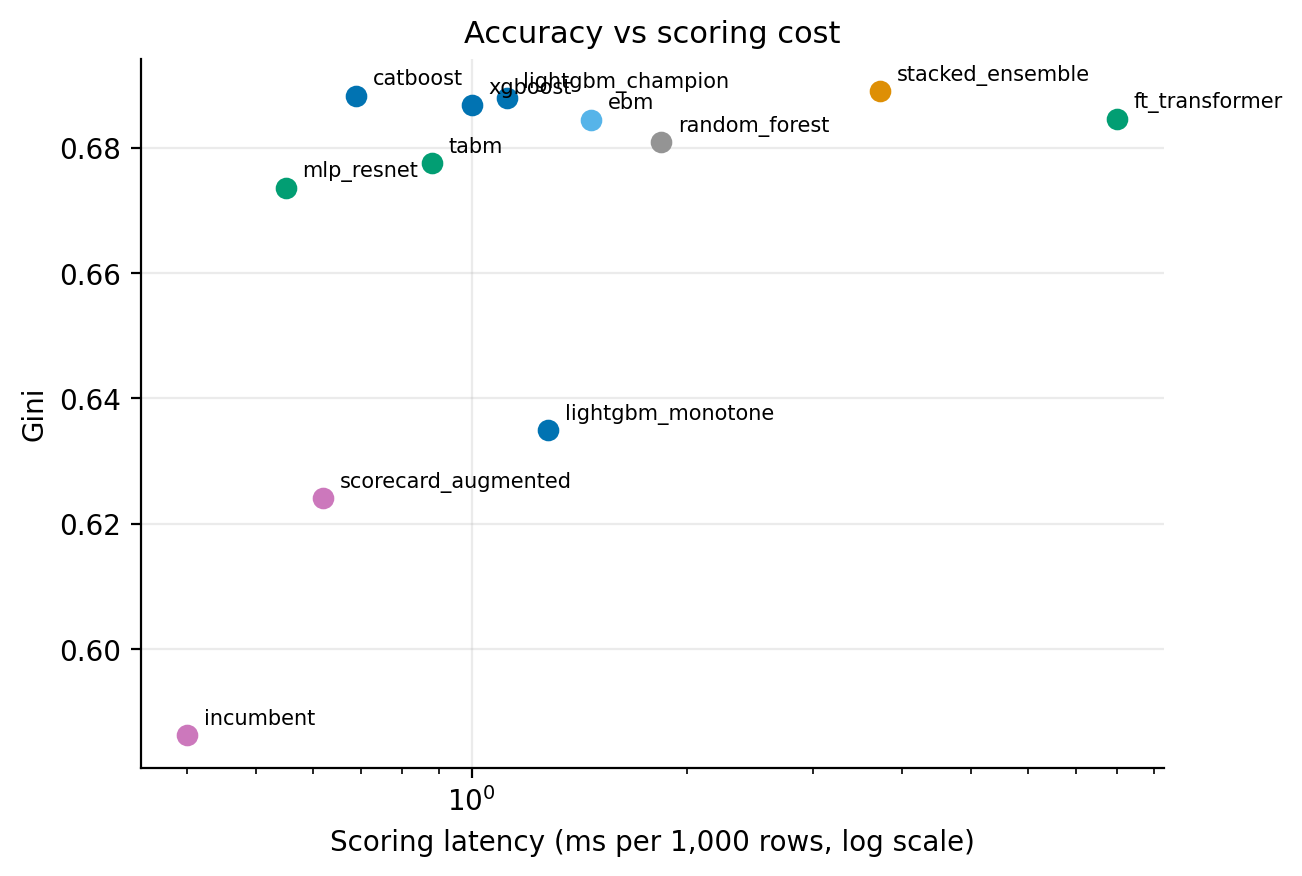
One champion is a single data point, so a follow-up benchmark runs twelve model variants on the identical splits and the same approved feature policy, scored with uniform metrics including expected calibration error (how far the predicted probabilities sit from the default rates actually realized) and scoring latency, because production scoring cares about milliseconds per thousand applications as much as Gini. The field covers the families a bank would shortlist: the scorecards, the boosted trees (LightGBM, XGBoost, CatBoost, and a monotonicity-constrained LightGBM), a random forest, three deep models (the FT-Transformer, a ResNet-style MLP, and TabM, a batch-ensemble MLP from Gorishniy et al. 2024), an explainable boosting machine, and a stacked ensemble of the best four.
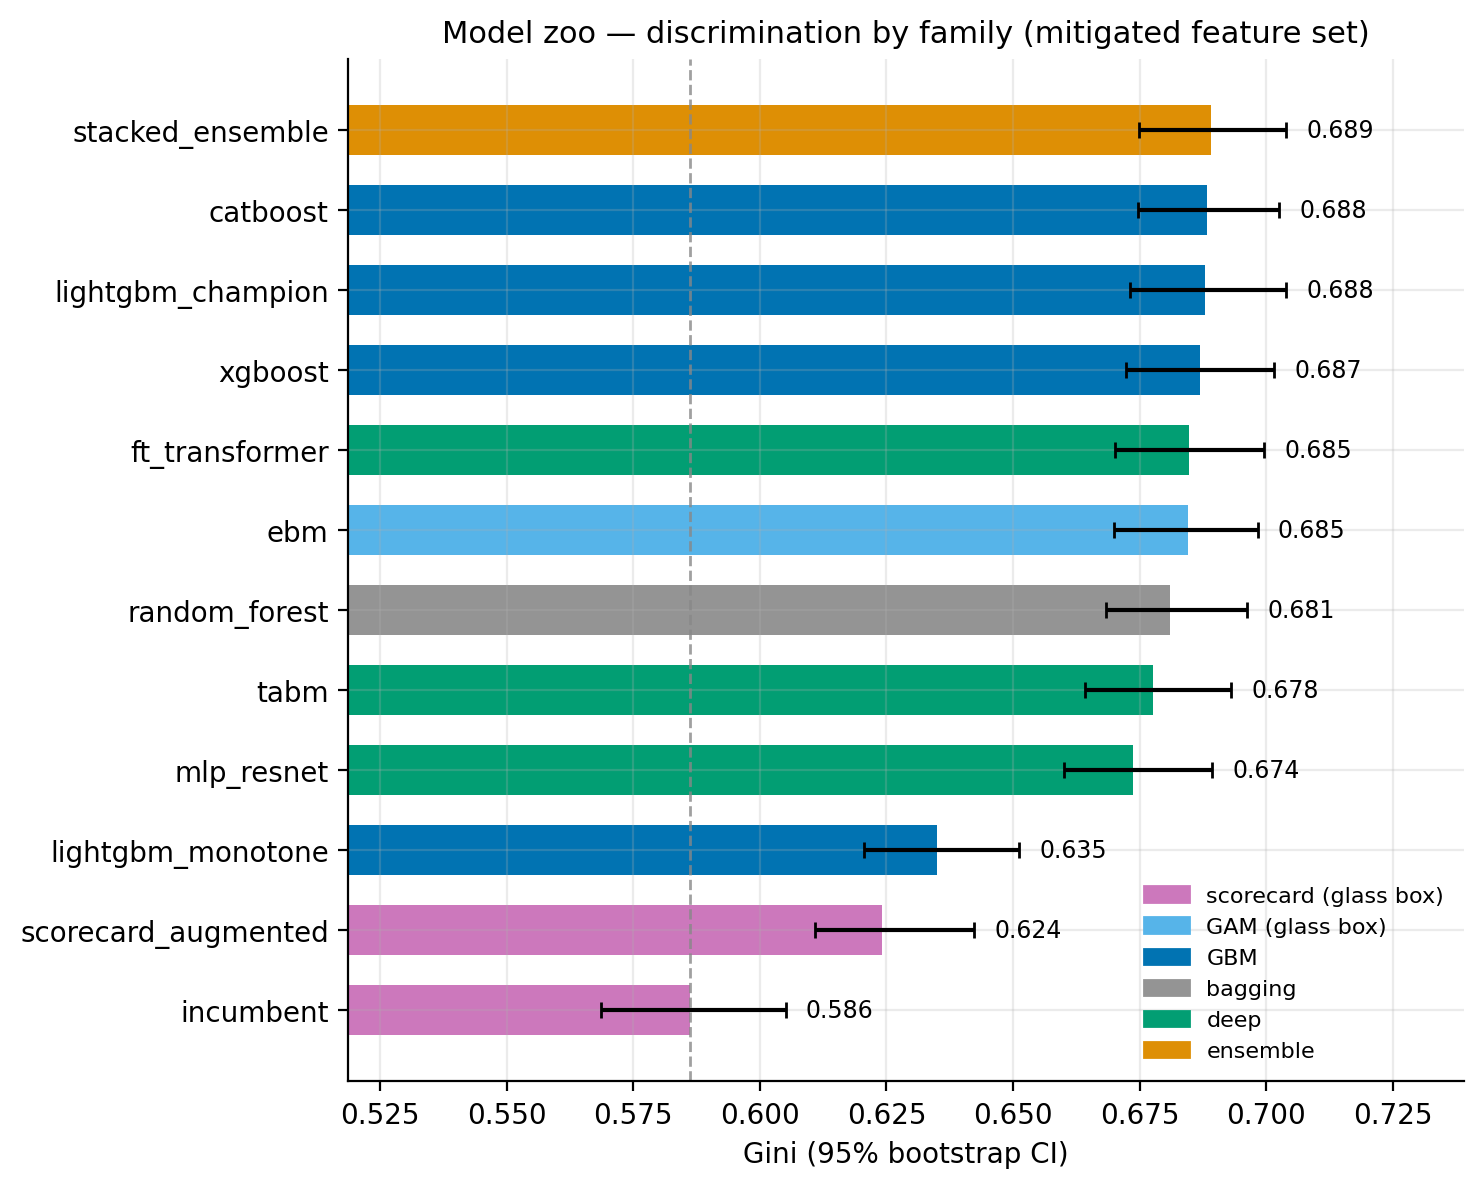
The results reorder the usual instincts. The explainable boosting machine, a generalized additive model where every term, including its 15 learned pairwise interactions, is a shape function you can plot, lands at Gini 0.6845, within 0.003 of the champion: nearly the whole lift survives in a model a validator can read term by term, which also confirms the portfolio's risk lives in pairwise interactions. Grafting six GBM-distilled interaction terms onto the incumbent scorecard recovers 37% of the lift (+0.038 Gini) with no architecture change at all, a real fallback if tree models were ever disallowed. Imposing regulator-friendly monotone constraints on 11 of 16 features costs 0.053 Gini, and the features left unconstrained are exactly the regime-dependent ones where forcing a direction would be wrong. The three deep models cluster with the boosted trees, none separating beyond confidence-interval noise, and the stacked ensemble adds 0.001 Gini over the champion, which says the families are all capturing the same signal. Finally, an isotonic calibration layer fails to improve the champion (expected calibration error 0.0022 before, 0.0024 after): it is already calibrated, and the layer is kept only as the first response if drift appears.
Step 6: explaining every decline
US law (ECOA and Regulation B) requires telling a declined applicant the principal reasons. The scoring API does this with SHAP values, a method that attributes a prediction to its input features such that the attributions sum exactly to the model's output margin. A decline response ranks the applicant's negative contributions and renders them as standard reason codes, for example "proportion of revolving balances to credit limits is too high", and because the listed contributions sum to the actual score shortfall, the explanation is faithful by construction rather than a post-hoc story. The API is a small FastAPI service; the repo includes sample adverse-action notices generated this way.
Step 7: the paperwork that makes it real
A model that cannot pass validation does not ship, whatever its Gini. The repo therefore includes the governance set: a model card stating intended use and limitations, a validation report structured the way SR 11-7 (the Federal Reserve's model risk guidance) expects, covering conceptual soundness, outcomes analysis, and the fair-lending review with a findings log, and a monitoring plan that sets drift thresholds on the population (PSI, a statistic that flags when incoming applicants stop resembling the training population), on Gini, and on the fairness ratios, with escalation paths and revalidation triggers. Writing these against a model whose failure modes are known by construction makes them concrete rather than boilerplate.
Limitations
The headline numbers are simulated, and simulated data is exactly as hard as its generator makes it; the design answers this with the ground-truth argument (the audit is validated against planted bias, which real data cannot offer) and with the Home Credit companion run on real applications, but the dollar figures inherit the simulator's assumptions and the stated LGD. The mitigation shown is feature exclusion, the bluntest instrument; threshold-per-group and adversarial debiasing are known alternatives with different legal postures. And the fairness suite tests the two planted mechanisms, not every mechanism a real portfolio could contain.
Links
- Source on GitHub (see also the long-form case study in the repo)
- Results summary and fairness report (every number above, with figures)
- The twelve-model zoo benchmark
- The SR 11-7 style validation report
- Gorishniy et al., Revisiting Deep Learning Models for Tabular Data (2021), the FT-Transformer implemented here.